
One of the most frequent questions I receive is how to effectively read and interpret mutual fund advertisements. I receive this question not only from individual investors, but from professional investment fiduciaries, such as pension plan sponsors, and securities/ERISA attorneys.
One of the first principles I was taught in law school was in my contracts class-“the large print giveth, and the small print taketh away.” Nowhere is that truer than with regard to investment advertising.
Another rule with regard to investment advertising is that it is as much about what is not said as it is about what is said. Current securities laws do not require that mutual fund companies disclose certain information that is crucial in properly evaluating a mutual fund.
As readers of this blog know, I am a staunch advocate of evaluating mutual funds in terms of their cost-efficiency. My position is based in large part on the fiduciary principles established by the Restatement (Third) of Trust (Restatement), especially Section 90, more commonly known as the “Prudent Investor Rule” (PIR).
Section 90 of the Restatement sets out several relevant standards in determining whether a fiduciary has fulfilled its fiduciary duty of prudence, including
- A fiduciary has a duty to be cost-conscious.1
- In selecting investments, a fiduciary has a duty to seek either the highest level of a return for a given level of cost and risk or, inversely, the lowest level of cost and risk for a given level of return.2
- Due to the impact of costs on returns, fiduciaries must carefully compare funds’ costs, especially between similar products.3
- Due to the higher costs and risks typically associated with actively managed mutual funds, a fiduciary’s selection of such funds is imprudent unless it can be shown that the fund is cost-efficient.4
Even if you are not a fiduciary, these standards are excellent guidelines to follow in selecting high-quality mutual funds. Many “professionals” will counter that there is more to evaluating a mutual fund that just its fees and expenses.
My response is that cost-efficiency considers both costs and return, more specifically, returns relative to costs. The importance of cost-efficiency in evaluating actively managed mutual funds is a result of comment h(2) of the PIR-as well as the results of numerous studies that have consistently concluded that the overwhelming majority of actively managed mutual funds are not cost-efficient, with findings such as
99% of actively managed funds do not beat their index fund alternatives over the long term net of fees.5
Increasing numbers of clients will realize that in toe-to-toe competition versus near–equal competitors, most active managers will not and cannot recover the costs and fees they charge.6
[T]here is strong evidence that the vast majority of active managers are unable to produce excess returns that cover their costs.7
[T]he investment costs of expense ratios, transaction costs and load fees all have a direct, negative impact on performance….[The study’s findings] suggest that mutual funds, on average, do not recoup their investment costs through higher returns.8
Load Fees
Before we address the issue of cost-efficiency overall, we should look at the impact of loads since most actively managed funds impose either a front-end load/fee or a back-end load/ fee, also known as a “contingency” load/fee, since they are usually only imposed if an investor tries to redeem the shares before a certain period of time has elapsed.
Front-end loads are imposed at the time an investor initially purchases the shares of a mutual fund. The practical result is that load fees reduce the amount of an investor’s initial investment, which in turn effectively reduces an investor’s return compared to a comparable fund that does not impose a load fee.
The maximum front-end load fee currently allowed by law is 5.75 percent. So how much impact does that have on an investor’s end-return? American Funds is one of the most well-known mutual fund groups in the United States. Their funds often appear in mutual fund lists, most notably their Growth Fund of America fund (GFOA). Since they do charge a 5.75 percent load on most of their retail shares, I will use one of their well-known marketing pieces for purposes of analysis in this post. The piece is available online at
The basic message of the “large print” is to claim that investors would have achieved greater returns over the period 1976-2018 had they invested in the American funds listed in the advertisement rather than an S&P 500-based index fund. But what does the small print say, taketh away?
The first thing I do is look for the “magic disclosure words” that typically appear in actively managed fund advertisements. The disclosure simply states that the returns do not reflect the subtraction of any loads or other expenses, which would have reduced the fund’s returns as stated in the advertisement. Funds are required to disclose a fund’s load-adjusted returns in the fund’s prospectus. In this advertisement, American Funds does state that the results shown do reflect the deduction of any sales loads.
However, two things immediately stand out. First, the ad does not provide any actual numbers that would allow an investor to verify the performance claims made in the advertisement. Several online sites consistently state that GFOA’s quarterly performance record, as of the five-year period ending September 30, 2019, was 10.62, with a load-adjusted return of 9.63 over that same time period. So GFOA’s load reduced an investor’s end-return by approximately 100 basis points. (A basis point is equal to .01 percent, and 100 basis points equals 1 percent.)
Secondly, the piece claims that the results are based on the performance of the funds from 1976 to 2018, and the deduction of the “maximum” 5.75 percent front-end load. However the piece notes that “[t]he maximum initial sales charge was 8.50% prior to July 1, 1988.” Therefore, the failure to subtract the maximum sales charge that existed prior to July 1, 1988, 8.50 percent, instead of the post-1988 5.75 percent, raises obvious questions about the validity of the return numbers cited in the advertisement and the advertisement’s overall claims as well, since the higher sales load would presumably result in lower returns for that period.
These are things lawyers look for, as should investors and investment fiduciaries as well. The claims in the advertisement may very well be legitimate, even after the appropriate sales load is deducted. However, without the numbers to independently verify the returns, we can only note the discrepancy regarding the sales-load deduction. As President Reagan said, “trust, but verify.”
Bottom line: Take the time to read the entire ad, remembering that “the large print giveth, and the small print taketh away.” Also take the time to go beyond the stated numbers and examine other factors related to performance.
“What Have You Done For Me Lately?”
Whenever I see mutual funds touting their long-term performance, I immediately look to see how the fund has performed more recently. The American Funds advertisement is a perfect example of why I include that step.
As we see in the chart provided, over the 1, 5, and 10 year period, with the exception of the AMCAP fund’s 10-year return, the listed American Funds have actually underperformed the S&P 500 Index. As an attorney or an investor, I would want to examine this further to try to determine what might have contributed to the underperformance other than general market conditions, e.g., factors such as poor management, a change in management, and/or excessive or increased fees.
Bottom line: The recent performance of the American Funds funds listed in the advertisement is not a ringing endorsement for investing in them at this time compared to the returns provided by comparable index funds
Cost-Efficiency Analysis
Given the knowledge that the listed American Funds funds have recently underperformed the S&P 500 index, we have a pretty good idea that none of those funds are cost-efficient relative to a comparable index fund benchmark. However, Morningstar categorizes the S&P 500 Index fund as a large cap blend fund, and not all of the listed American Funds funds are large cap blend funds.
For instance, GFOA is categorized as a large cap growth fund. Therefore, in assessing cost-efficiency, GFOA should be compared to an appropriate benchmark, a comparable large cap growth index fund.
I typically use Vanguard’s index funds for benchmarking purposes. There are those that claim it is not appropriate to use Vanguard’s index funds for benchmarking purposes due to significant difference in their business platforms, that that would be unfairly comparing “apples to oranges.”
As they like to say on South Georgia quail preserves, “that dog don’t hunt.” Whether we are talking about ERISA plans/accounts or non-ERISA accounts, if we accept the proposition that the goal is the protection and financial betterment of the plan participant and/or retail client, a fund’s business platform is totally irrelevant. The First Circuit Court of Appeals’ recent decision in Brotherston v. Putnam Investments, LLC totally, and brilliantly, rejected that argument.9 (Note: Putnam has filed for a writ of certiorari, asking the Supreme Court to hear the case. As of yet, the Court has not decided whether to hear the case.)
The Active Management Value Ratio™
Based upon the Restatement and the studies of investment icons such as Nobel laureate Dr. William F. Sharpe and Charles D. Ellis, I created a simple metric, the Active Management Value Ratio™ (AMVR), that allows investors, investment fiduciaries and attorneys to quickly determine the cost-efficiency of an actively managed mutual fund.
In analyzing an investment option, Nobel laureate William F. Sharpe has noted that
[t]he best way to measure a manager’s performance is to compare his or her return with that of a comparable passive alternative. 10
Building on Sharpe’s theory, investment icon Charles D. Ellis has provided further advice on the process used in evaluating the cost-efficiency of an actively managed mutual fund.
So, the incremental fees for an actively managed mutual fund relative to its incremental returns should always be compared to the fees for a comparable index fund relative to its returns.
When you do this, you’ll quickly see that that the incremental fees for active management are really, really high—on average, over 100% of incremental returns!11
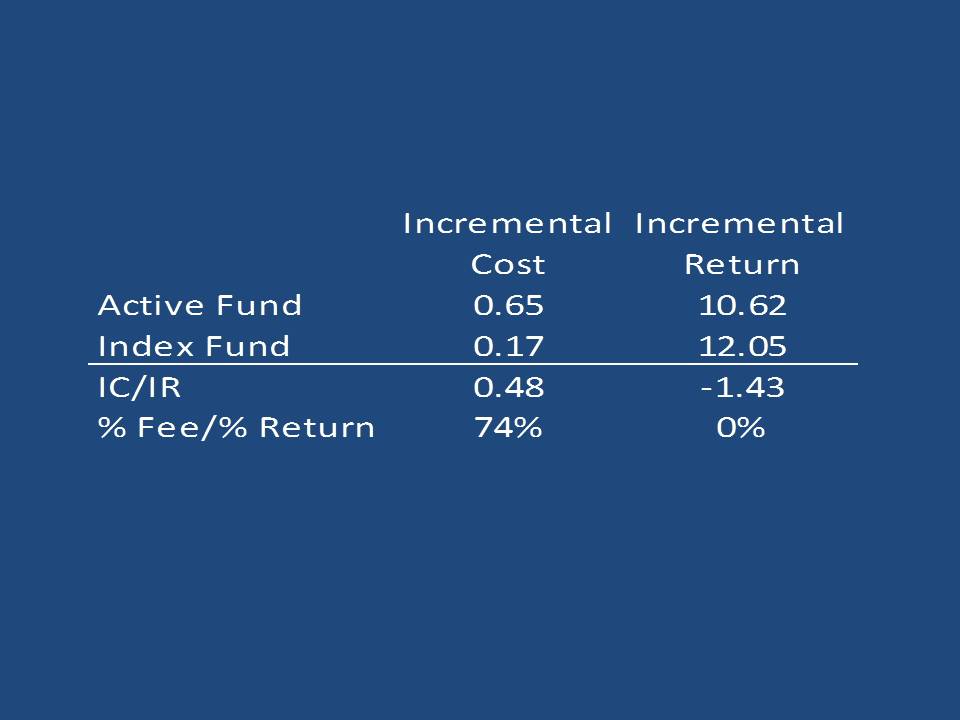
While I normally adjust a fund’s return for any loads, when applicable, and for risk, that is not necessary in the case of GFOA’s nominal returns AMVR analysis. In the case of GFOA, the basic AMVR analysis quickly reveals the cost-inefficiency of the retail version of the fund.
Since GFOA underperforms the benchmark, Vanguard’s Growth Index (VIGRX), the extra incremental cost is essentially money just thrown away, the antithesis of prudent wealth management. As the introduction to Section 7 of the Uniform Prudent Investor Act states, “wasting beneficiaries’ money is imprudent.”
From a cost-efficiency standpoint, it should also be noted that 74 percent of GFOA’s total expense ratio (48/65) produced no positive incremental return above the return of the benchmark. Again, wasted money.
 Note: The process used for performing an AMVR analysis on an actively managed mutual fund’s retirement shares is exactly as described above. The only difference is that retirement shares do not impose load fee…or least a plans sponsor or other investment fiduciary had better not select such funds.l
AMVR Plus
The AMVR metric provides extremely useful information regarding the cost-efficiency of an actively managed mutual fund. However , an investor’s analysis should not end there if they want a truly accurate cost-efficiency analysis of an actively managed mutual fund. There is a direct, negative relationship between a fund’s R-squared correlation number, a fund’s incremental costs, and the fund’s cost-efficiency. Morningstar states that R-squared reflects the percentage of a fund’s movements that are explained by movements in its benchmark index, [rather than any contribution by the fund’s management team.]
Professor Ross Miller of the State University of New York/Albany did a study on the impact of closet indexing, focusing primarily on the relationship between an actively managed mutual fund’s R-squared number, “closet index” status, and the resulting overall financial impact of the two. “Closet index” funds are actively managed funds whose returns are essentially the same as a comparable index fund, but who charge much higher fees than the index fund. The higher an actively managed fund’s R-squared number, the greater the likelihood that the actively managed fund can be classified as a closet index fund.
An R-squared rating of 98 would indicate that 98 percent of an actively managed mutual fund’s returns could be attributed to an index fund rather than the active fund’s management team. If an investor is paying an annual expense fee of 1% for an actively managed mutual fund that only contributes 2 percent of the fund’s total return, and a comparable index fund is producing 98% of the fund’s return, while charging an annual expense fee of just 0.20% percent, the effective annual expense ratio for the actively managed fund is significantly higher than the stated 1%.
There is no universally agreed upon level of R-squared that designates an actively managed mutual fund as a closet index fund. I use an R-squared correlation number of 90 as my threshold indicator for closet index status.
Miller’s findings were extremely interesting, namely that
Mutual funds appear to provide investment services for relatively low fees because they bundle passive and active funds management together in a way that understates the true cost of active management.
In particular, funds engaging in ‘closet’ or ‘shadow’ indexing charge their investors for active management while providing them with little more than an indexed investment.
Even the average mutual fund, which ostensibly provides only active management, will have over 90% of the variance in its returns explained by its benchmark index.12
As a result of his study, Ross Miller, created the Active Expense Ratio (AER) metric. A fund’s AER number is based on a fund’s R-squared number.
Since many investors are unfamiliar with the AER metric, a frequent question I receive is why even calculate an AER-adjusted AMVR. One of the benefits of calculating an actively managed fund’s AER number is that the calculation process results in calculating the actual percentage of active management provided by the actively managed fund in question. Miller refers to this measurement as a fund’s “active weight.”
Deriving a fund’s “active weight” number provides valuable insight into the amount of active management actually provided by a fund purporting to provide active management, especially since such funds ‘ higher fees are based on the purported benefits of active management. However, Miller claims the primary benefit of calculating a fund’s AER number is that the AER provides investors with a quantitative analysis of the implicit cost of the fund’s active management component. The AER accomplishes this by simply dividing an actively managed fund’s incremental cost by the fund’s active weight number.
In many cases, once a fund’s R-squared correlation number is factored in, the fund’s AER is significantly higher than the fund’s stated expense, often as much as 400-500 percent higher. Investors and investment fiduciaries should remember John Bogle’s advice on investment costs, “you get what you don’t pay for, as well as the fact that simple mathematics proves that each one percent in fees and expenses reduces an investor’s or fiduciary’s end-return by approximately seventeen percent over a twenty-year time period.
Adjusting our AMVR analysis to incorporate GFOA’s AER number results in the following AMVR chart:
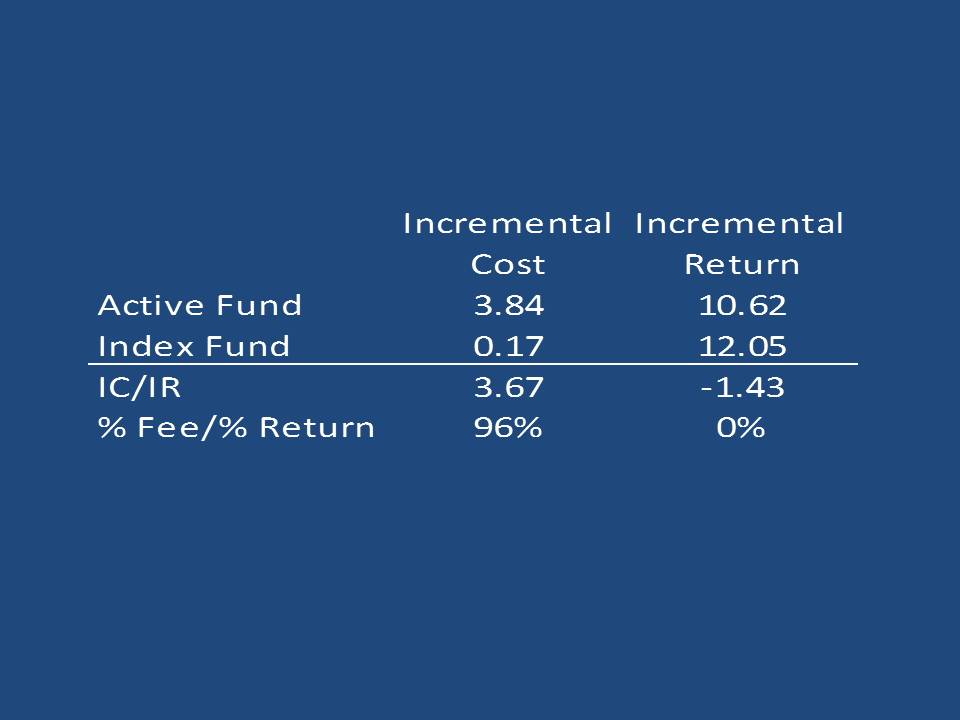
Factoring in GFOA’s AER and the fund’s increased implicit costs as a result of GFOA’s high r-squared number (98) relative to a comparable large cap growth benchmark (VIGRX), and its GFOA’s Active Weight number (0.1250), simply emphasizes the cost-inefficiency and overall imprudence of GFOA’s retail shares relative to the comparable, less expensive Vanguard Growth Index Fund (VIGRX).
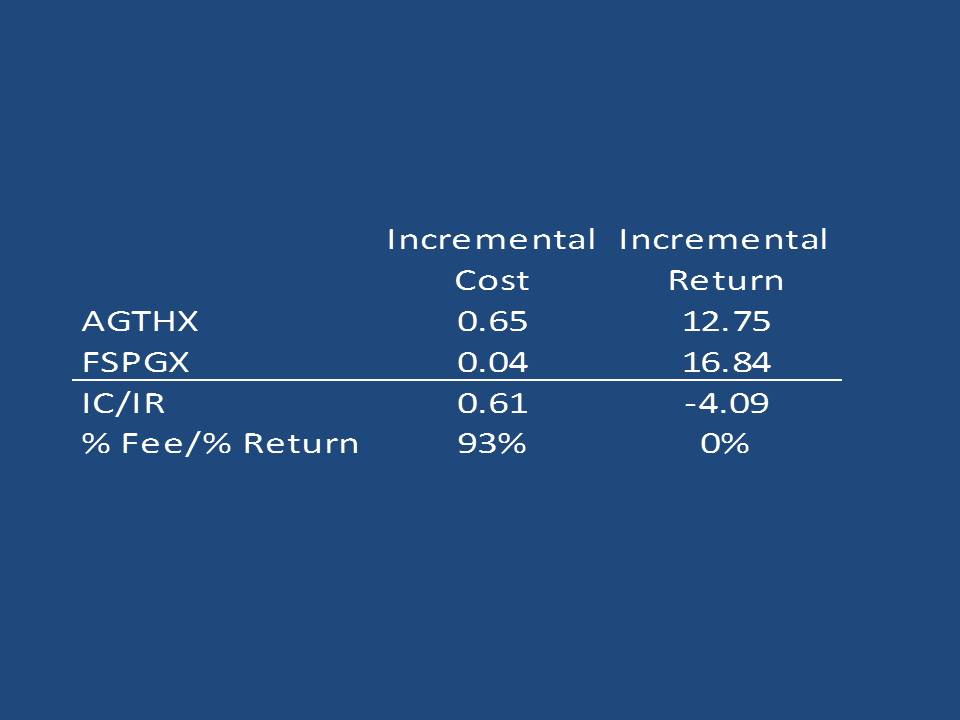
I have always used Vanguard’s index funds, as they traditionally have had the lowest expense ratios and highest cost-efficiency rating. As more funds adjust their fees and expenses, it may become prudent to calculate AMVR numbers using multiple comparable benchmarks.
For instance, Fidelity has recently significantly reduced the fees and expenses on a number of new or existing index funds. Substituting Fidelity Large Cap Growth Index fund, FSPGX, as our benchmark fund, the AMVR chart using the AGTHX’s and FSPGX’s three-year nominal, or stated, numbers, would have resulted in an even more dramatic analysis of AGTHX’s cost-efficiency.
Adjusting AGTHX’s three-year nominal numbers for applicable front-end loads/fees and AER would have resulted in the following AMVR chart.
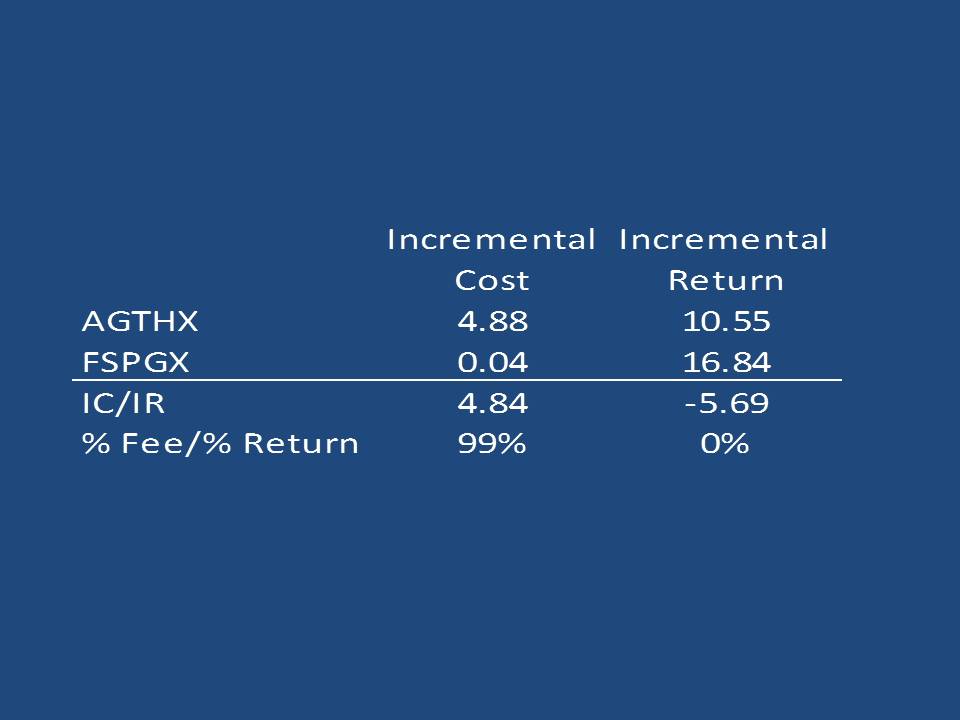
The only reservation I have regarding the use of the new lower-cost Fidelity funds at this point is their short track record. The numbers in the referenced chart only cover the most recent three-year period, as the fund began operations in 2016. Although I fully expect the new low-cost Fidelity funds to perform comparably to other index funds, I prefer to a use funds with at least a five-year performance record, as that usually includes at least one down performance, which provides a better overall example of how a fund may perform in such situations.
Some people avoid the whole closet index debate and simply calculate a mutual fund’s cost-efficiency using the basic AMVR calculation and then answering two simple questions:
(1) Does the actively managed mutual fund provide a positive incremental return relative to the benchmark being used?
(2) If so, does the actively managed fund’s positive incremental return exceed the fund’s incremental costs relative to the benchmark?
If the answer to either of these questions is “no,” the actively managed fund is both cost-inefficient and unsuitable/imprudent according the the Restatement’s prudence standards and should be avoided. The goal for an actively managed fund is an AMVR number greater than “0” (indicating that the fund did provide a positive incremental return), but equal or less than “1” (indicating that the fund’s incremental costs did not exceed the fund’s incremental return).
At the end of the day, common sense tells us that prudent investors do not knowingly waste money by investing in cost-inefficient investments. It may require a little more work, but by using the AMVR metric, alone or in combination with Miller’s AER metric, investors can better protect their financial security and investment fiduciaries can hopefully avoid unnecessary personal liability exposure.
Going Forward
Facts do not cease to exist because they are ignored.
Aldoux Huxley
The simple numbers and numerous studies consistently establish that the overwhelming majority of actively managed mutual funds simply are not cost-efficient. As a result, such funds are imprudent under the Restatement (Third) of Trusts. Therefore, legally, a recommendation or use of such funds would constitute a violate a breach of one’s fiduciary duties. A strong argument could also be made that a stockbroker’s and/or adviser’s recommendation or use of a cost-inefficient actively managed mutual fund would constitute a violation of both the SEC’s new “best interest” rule and FINRA’s suitability and “fair dealing” requirements.
I have written previously about the importance of the ultimate decision in Putnam Investments, LLC v. Brotherston. Putnam has appealed the First Circuit’s decision, which held that a pension plan, not the plan participants, has the burden of proof regarding causation of damages sustained by the plan participants. If the Supreme Court upholds the First Circuit’s decision, either expressly or by simply refusing to hear the case, I believe it will cause a significant change in the landscape of the entire 401(k)/4043(b) industry.
My opinion is based on the examples we have examined herein, examples that show that plans, as well as plan advisers, will be hard-pressed in most cases to meet such a burden of proof, to prove that the funds that they selected for the plan participants were cost-efficient. I believe that this would result in more potential liability exposure and multi-million dollar judgements and settlements in favor of plan participants, unless and until 401(k) and 403(b) plans make the necessary adjustments, namely choosing only cost-efficient investment options for their plans.
Notes
1. Restatement (Third) Trusts, Section 90, cmt. b (American Law Institute).
2. Restatement (Third) Trusts, Section 90, cmt. f (American Law Institute).
3. Restatement (Third) Trusts, Section 90, cmt. m (American Law Institute).
4. Restatement (Third) Trusts, Section 90, cmt. h(2) (American Law Institute).
5. Laurent Barras, Olivier Scaillet and Russ Wermers, False Discoveries in Mutual Fund Performance: Measuring Luck in Estimated Alphas, 65 J. FINANCE 179, 181 (2010).
6. Charles D. Ellis, The Death of Active Investing, Financial Times,January 20, 2017, available online at https://www.ft.com/content/6b2d5490-d9bb-11e6-944b-eb37a6aa8e.
7. Philip Meyer-Braun, Mutual Fund Performance Through a Five-Factor Lens, Dimensional Fund Advisors, L.P., August 2016.
8. Mark Carhart, On Persistence in Mutual Fund Performance, Journal of Finance, Vol. 52, No. 1, 57-8 (1997).
9. Brotherston v. Putnam Investments, LLC, 907 F.3d 17 (2018).
10. Willam F. Sharpe, “The Arithmetic of Active Investing,” available online at https://web.stanford.edu/~wfsharpe/art/active/active.htm.
11. Charles D. Ellis, “Letter to the Grandkids: 12 Essential Investing Guidelines,” available online athttps://www.forbes.com/sites/investor/2014/03/13/letter-to-the-grandkids-12-essential-investing-guidelines/#cd420613736c
12. 1. Ross M. Miller, Measuring the True Cost of Active Management by Mutual Funds, Journal of Investment Management, Vol. 5, No. 1, First Quarter 2007. Available at SSRN: https://ssrn.com/abstract=972173
© Copyright 2019 The Watkins Law Firm. All rights reserved.
This article is for informational purposes only, and is neither designed nor intended to provide legal, investment, or other professional advice since such advice always requires consideration of individual circumstances. If legal, investment, or other professional assistance is needed, the services of an attorney or other professional advisor should be sought.

